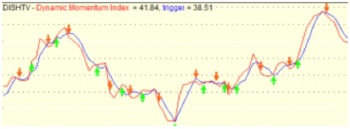
Chart analysis is one of many techniques in technical analysis. Chart pattern is a term of technical analysis used to analyze a stock's price action according to the shape its price chart creates. Trading by chart patterns is based on the premise that once a chart forms a pattern the short term price action is predictable to an extent. For instance, if a chart creates a "channel" the stock price will be bouncing off the upper and lower boundary until it breaks out. Based on each pattern's rules many different trading strategies can be applied. Candlesticks chart is the most popular among technical traders.

Candlesticks are graphical representations of price movements for a given period of time. They are commonly formed by the opening, high, low, and closing prices of a financial instrument.If the opening price is above the closing price then a filled (normally red or black) candlestick is drawn. If the closing price is above the opening price, then normally a green or a hollow candlestick (white with black outline) is shown. The filled or hollow portion of the candle is known as the body or real body, and can be long, normal, or short depending on its proportion to the lines above or below it. The lines above and below, known as shadows, tails, or wicks represent the high and low price ranges within a specified time period. However, not all candlesticks have shadows. For reversal pattern, candlestick has Hammer, Inverted Hammer, Hanging man, Shooting Star, Engulfing, Harami, Morning Star, Evening Star.


